
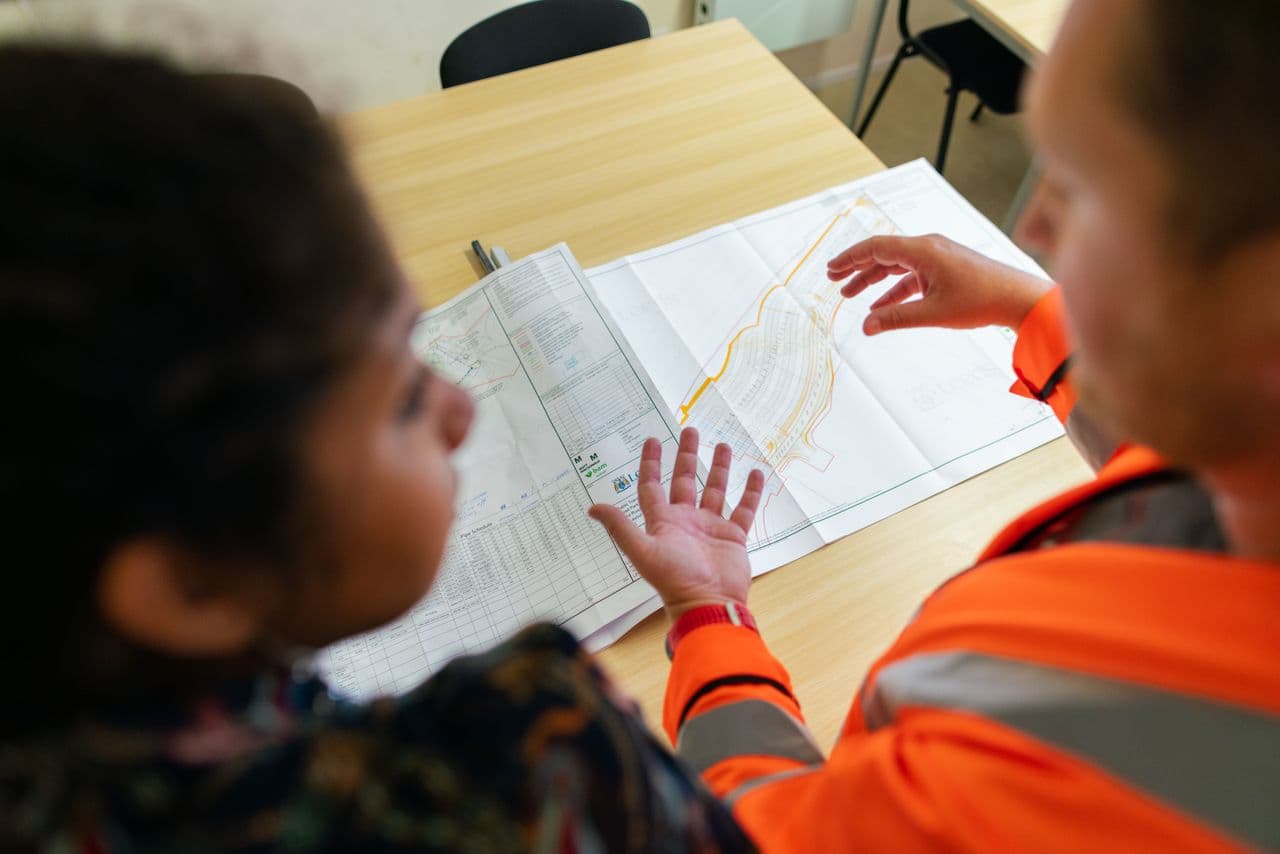


Civil Engineers pay in the United States
What this work is
Perform engineering duties in planning, designing, and overseeing construction and maintenance of building structures and facilities, such as roads, railroads, airports, bridges, harbors, channels, dams, irrigation projects, pipelines, power plants, and water and sewage systems.
Where the money actually goes furthest
California pays the highest headline figure at $122,500. Adjusted for what things cost there it is worth $110,639 — less than Louisiana, where $105,380 is worth $119,464.
Pay by state
53 states and territories publish a median for this occupation. Switch the ranking to see how much the order changes.
Adjusted for what things cost in that state.
| State | Hourly | Annual | Worth locally | After state tax | Jobs |
|---|---|---|---|---|---|
| Louisiana | $50.66/hr | $105,380 | $119,464 | $102,593 | 3,780 |
| Mississippi | $48.16/hr | $100,170 | $115,204 | $95,863 | 1,770 |
| Nebraska | $49.59/hr | $103,150 | $114,483 | $98,695 | 2,360 |
| New Mexico | $49.95/hr | $103,900 | $112,677 | $99,693 | 1,350 |
| Oklahoma | $47.48/hr | $98,760 | $112,431 | $94,559 | 2,180 |
| Alaska | $55.16/hr | $114,730 | $112,084 | $114,730 | 1,670 |
| Kentucky | $48.53/hr | $100,930 | $111,945 | $97,019 | 2,690 |
| Alabama | $47.60/hr | $99,010 | $111,472 | $94,249 | 5,370 |
| South Dakota | $47.45/hr | $98,700 | $111,412 | $98,700 | 1,440 |
| California | $58.89/hr | $122,500 | $110,639 | $115,080 | 55,180 |
| North Dakota | $47.21/hr | $98,190 | $110,375 | $97,505 | 1,380 |
| Iowa | $46.36/hr | $96,430 | $109,879 | $93,320 | 2,500 |
| South Carolina | $48.85/hr | $101,600 | $108,373 | $96,883 | 7,180 |
| Kansas | $46.58/hr | $96,880 | $107,560 | $91,762 | 2,880 |
| North Carolina | $48.43/hr | $100,730 | $106,784 | $96,990 | 12,810 |
| Indiana | $47.25/hr | $98,270 | $105,293 | $95,351 | 4,030 |
| Tennessee | $46.11/hr | $95,910 | $104,397 | $95,910 | 5,790 |
| Nevada | $50.15/hr | $104,310 | $104,330 | $104,310 | 3,560 |
| Ohio | $46.26/hr | $96,220 | $103,718 | $94,290 | 10,560 |
| Minnesota | $48.79/hr | $101,480 | $102,900 | $96,042 | 4,710 |
| Washington | $52.89/hr | $110,000 | $102,794 | $110,000 | 12,590 |
| Idaho | $47.13/hr | $98,030 | $102,659 | $93,608 | 2,630 |
| Missouri | $44.59/hr | $92,750 | $102,125 | $89,247 | 5,760 |
| Oregon | $50.60/hr | $105,250 | $101,828 | $96,581 | 4,890 |
| Massachusetts | $51.31/hr | $106,730 | $100,917 | $101,393 | 9,450 |
| Maine | $47.03/hr | $97,820 | $100,793 | $92,378 | 1,240 |
| Wisconsin | $45.48/hr | $94,600 | $100,531 | $90,683 | 7,410 |
| Delaware | $48.19/hr | $100,220 | $100,410 | $94,836 | 920 |
| Pennsylvania | $47.04/hr | $97,850 | $100,286 | $94,846 | 15,870 |
| Illinois | $47.96/hr | $99,760 | $99,799 | $94,959 | 13,910 |
| Texas | $46.57/hr | $96,860 | $99,793 | $96,860 | 34,870 |
| Connecticut | $49.59/hr | $103,150 | $99,556 | $98,211 | 4,370 |
| Colorado | $48.76/hr | $101,420 | $98,418 | $97,730 | 13,290 |
| Montana | $44.75/hr | $93,070 | $98,330 | $88,693 | 1,870 |
| Utah | $46.56/hr | $96,830 | $97,946 | $92,424 | 5,670 |
| Arkansas | $40.88/hr | $85,020 | $97,791 | $81,880 | 1,870 |
| Wyoming | $43.55/hr | $90,590 | $97,734 | $90,590 | 990 |
| Vermont | $45.96/hr | $95,600 | $97,590 | $91,227 | 770 |
| West Virginia | $41.79/hr | $86,930 | $97,128 | $83,578 | 1,300 |
| Rhode Island | $47.74/hr | $99,300 | $97,086 | $95,883 | 1,270 |
| New Jersey | $50.32/hr | $104,660 | $96,186 | $100,119 | 6,900 |
| New York | $49.89/hr | $103,760 | $96,145 | $98,582 | 17,500 |
| Virginia | $46.69/hr | $97,120 | $96,063 | $92,281 | 11,350 |
| Maryland | $48.41/hr | $100,680 | $95,922 | $96,078 | 5,240 |
| Michigan | $44.28/hr | $92,100 | $95,718 | $88,423 | 7,760 |
| Florida | $47.39/hr | $98,570 | $95,319 | $98,570 | 23,750 |
| New Hampshire | $47.46/hr | $98,710 | $94,758 | $98,710 | 1,620 |
| District of Columbia | $49.94/hr | $103,880 | $94,522 | $97,891 | 1,650 |
| Arizona | $43.10/hr | $89,660 | $89,054 | $87,783 | 5,940 |
| Georgia | $40.50/hr | $84,240 | $87,485 | $80,490 | 9,400 |
| Hawaii | $45.33/hr | $94,280 | $85,748 | $88,557 | 2,640 |
| Guam | $32.41/hr | $67,410 | Not published | Not published | 640 |
| Puerto Rico | $29.35/hr | $61,060 | Not published | Not published | 1,750 |
National median for comparison: $100,840. “Worth locally” divides pay by the area’s price level, so a figure above the headline means money goes further there than the US average.
$48.48/hr an hour, national median
Across the states
25th to 75th percentile, lowest and highest state
Drop your résumé — it never leaves your browser